Client Lead Crawler
Client Lead Crawler
Client | Automated Lead Intelligence System — Memphis Metro Area
Overview
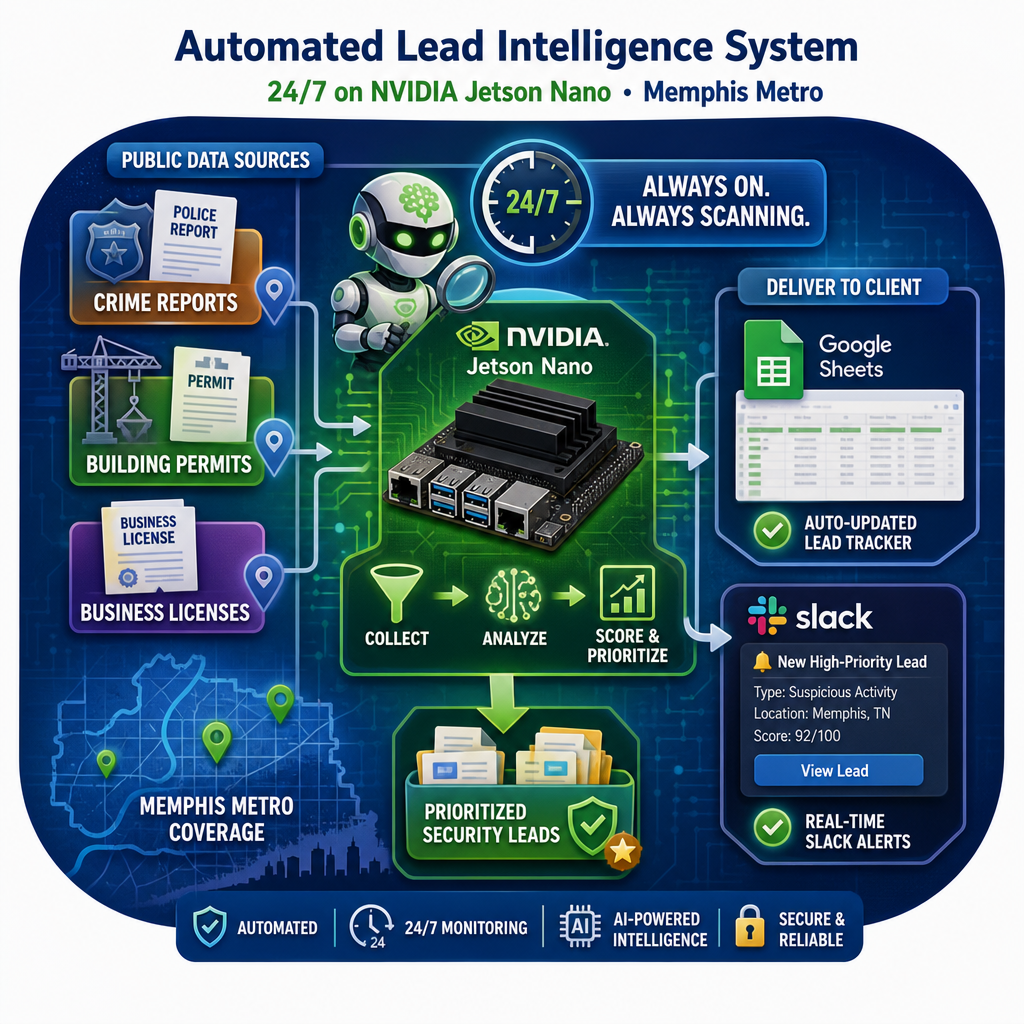
The Client Lead Crawler is a 24/7 automated intelligence system deployed on a dedicated NVIDIA Jetson Nano device at Client headquarters. Every morning at 8:00 AM, it scans four public data sources across the Memphis metro area, identifies businesses and properties most likely to need security services, scores each lead for urgency, and delivers a prioritized pipeline directly to the Client team — with high-priority alerts pushed instantly to their phones via Slack.
No manual research. No cold calling lists. Every lead is triggered by a real event.
The Challenge
Client’s sales team spent significant time manually researching potential clients — scanning news articles, cold-calling businesses, and relying on word-of-mouth referrals. This reactive approach missed high-value opportunities: businesses that had just experienced a break-in, new commercial buildings under construction, and freshly licensed businesses with no security infrastructure in place.
Client needed a system that would surface these leads automatically, before competitors could act.
The Solution
We designed and deployed a Python-based crawler running on a Jetson Nano at Client’s office. The system pulls from four free, public data sources daily:
| Source | What It Finds | Coverage |
|---|---|---|
| Memphis Police Dept (MPD) | Commercial burglaries, robberies, theft, vandalism | City of Memphis, updated daily |
| Shelby County Building Permits | New commercial construction & renovation projects | Shelby County TN, continuously |
| Memphis Business Licenses | Newly registered commercial businesses | City of Memphis, continuously |
| SAM.gov Federal Contracts | Government facilities needing security services | TN, MS, AR statewide |
Every lead receives a Risk Score from 0–100 based on crime severity, repeat targeting, crime density within a 5-mile radius, property value, active construction status, and business type alignment with Client’s service offerings.
How Leads Are Scored
- Crime severity — robbery, burglary, and B&E score higher than vandalism
- Repeat targeting — same address hit multiple times in a week scores significantly higher
- Crime density — number of incidents within a 5-mile radius of the property
- Property value — commercial properties appraised over $500K score higher
- Active construction — sites currently under permit are more vulnerable
- Business type — retail, warehouse, restaurant, and storage facilities match Client service offerings
🔴 High Priority (70–100)
Immediate outreach recommended
🟡 Medium Priority (40–69)
Add to active pipeline
🟢 Low Priority (0–39)
Monitor
AI-Powered Intelligence Pipeline
Behind every lead is a multi-stage AI pipeline that transforms raw public data into actionable, scored intelligence. Each stage is purpose-built for accuracy, speed, and relevance to the security industry.
1. Data Ingestion
Automated collectors run each morning against four live public data sources — police incident feeds, county permit APIs, city business license registries, and federal contract databases. Each collector handles rate limiting, pagination, and format variations independently, ensuring no records are missed. Raw data is timestamped and stored locally on the Jetson Nano before processing begins.
2. Data Normalization
Incoming records arrive in inconsistent formats — CSV exports, JSON APIs, HTML tables, and PDF-scraped text. The normalization layer standardizes all records into a unified schema: business name, address, incident type, date, geographic coordinates, and source. Address standardization resolves abbreviations, suite formats, and misspellings to enable accurate geo-matching across sources.
3. Entity Recognition
Named entity recognition (NER) extracts and classifies key entities from unstructured text fields — business names, property owners, incident descriptions, and location references. The system identifies commercial vs. residential properties, matches businesses across data sources by name and address proximity, and flags entities that appear in multiple datasets (e.g., a business with both a new license and a recent crime incident at the same address).
4. Geo-Spatial Analysis
Every record is geocoded and plotted against the 11-county coverage area. The system calculates crime density radii (incidents within 0.5, 1, and 5 miles), cross-references building permit locations with high-crime zones, and clusters nearby incidents to detect patterns invisible in a flat list. Businesses in high-density crime corridors receive automatic score boosts regardless of whether they’ve been directly targeted.
5. Scoring Engine
Each lead is scored 0–100 using a weighted multi-factor model trained on historical security sales data. Factors are evaluated and combined in real time:
| Factor | Weight | Logic |
|---|---|---|
| Crime severity | High | Robbery > Burglary > Theft > Vandalism |
| Repeat targeting | High | Same address hit 2+ times in 7 days |
| Crime density | Medium | Incident count within 5-mile radius |
| Property value | Medium | Commercial appraisal > $500K scores higher |
| Business type match | Medium | Retail, warehouse, storage, restaurant |
| Active construction | Low–Medium | Open building permit = vulnerable site |
| New business | Low | Newly licensed = no security infrastructure |
| Federal contract | Low–Medium | Government facilities require compliance-grade security |
6. Deduplication & Enrichment
Before output, the pipeline deduplicates leads that appear across multiple data sources for the same entity. Duplicate records are merged and their scores compounded — a business appearing in both crime reports and new license data scores significantly higher than either source alone. Property owner contact information is appended where publicly available via county assessor records.
7. Alerting
The alerting layer monitors score thresholds in real time as records are processed. Any lead scoring 70 or above triggers an immediate push to the client’s Slack channel — formatted with business name, address, score, trigger event, and nearby incident count. Alerts fire within seconds of scoring, ensuring the team can act before competitors become aware of the opportunity. Daily digest summaries are also written to the Google Sheets pipeline for the full lead list.
8. Continuous Learning
The scoring model is designed to be refined over time. As the client’s team closes deals and marks leads as converted or irrelevant, that feedback can be fed back into the weighting model to improve precision — shifting score weights toward the factors that consistently predict successful engagements in this specific market.
Key Outputs
Google Sheets — Client Lead Pipeline
A live spreadsheet updated every morning with all new leads. Includes business name, address, risk score, trigger event, property owner contact, and recommended Client services. A built-in dashboard shows pipeline totals, source breakdowns by county, and the top 10 highest-priority leads at a glance.
Slack Alerts
When a lead scores 70 or above, an instant alert is pushed to the Client Slack channel — visible on any phone within seconds of the pipeline running. Each alert includes the business name, location, trigger event, and nearby crime count.
Coverage Area
Shelby County TN · Tipton County TN · Fayette County TN · DeSoto County MS · Marshall County MS · Tate County MS · Coahoma County MS · Tunica County MS · Benton County MS · Crittenden County AR · St. Francis County AR
Technology
Runs on a compact NVIDIA Jetson Nano device. All data transmissions are encrypted over a private VPN. The system requires no ongoing manual input and costs nothing to operate beyond the hardware already in place.